Access Options
Member Only Content
Please log in to view availability or download this document.
| Published | October 04, 2010 |
|---|---|
| Type | Project Report |
| Thematic Category | Water Resources |
| Project | Groundwater Potential Zonation & Surface Water Inventory Mapping of Mizoram |
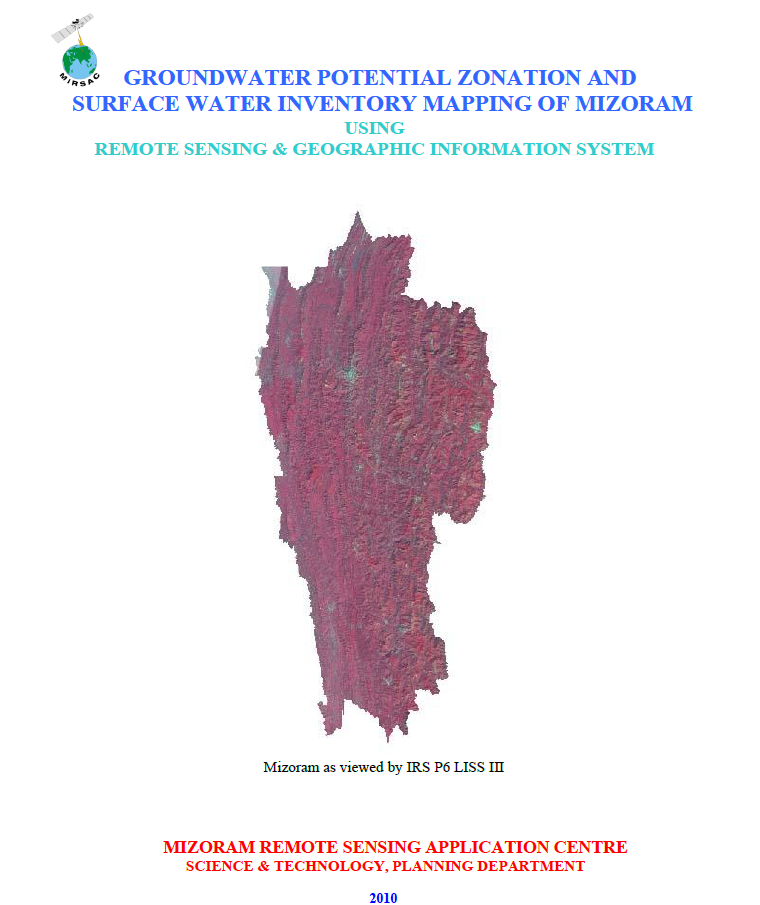
Groundwater Potential Zonation & Surface water inventory mapping of Mizoram using Remote Sensing & GIS
Abstract / Description
The project “Groundwater Potential Zonation and Surface Water Inventory Mapping of Mizoram using Remote Sensing & Geographic Information System” was undertaken by the Mizoram Remote Sensing Application Centre (MIRSAC), Science & Technology, Planning Department, with funding support from the Public Health Engineering Department (PHED), Government of Mizoram. The study was designed to provide a State-wide scientific assessment of groundwater prospects and surface-water resources to support water-supply planning in a region where rapid population growth and urbanization are increasing demand for dependable water sources. The study covered the entire 21,087 sq. km geographical area of Mizoram and all eight districts.
The methodology combined IRS-P6 LISS-III satellite imagery, Survey of India topographic maps, administrative boundaries and ancillary thematic information. The LISS-III data, with 23 m spatial resolution and four spectral bands, were considered suitable for mapping at 1:50,000 scale. Groundwater potential assessment was carried out by integrating lithology, geomorphology, geological structures, slope, Digital Elevation Model information and available spring/hand-pump indicators in an ARC/INFO GIS environment. Individual thematic units were assigned relative weightages based on their hydrogeological significance, and the final groundwater potential map was classified into Very Good, Good, Moderate and Poor zones.
The analysis showed that only 1,790.22 sq. km (8.49%) of Mizoram falls under the Very Good groundwater-potential category, primarily within valley fills, flood plains, low-lying terrain and structurally favourable areas. The Good zone covers 4,340.06 sq. km (20.58%), while Moderate potential accounts for 6,655.92 sq. km (31.56%). The largest proportion, 8,300.81 sq. km or 39.36%, lies within the Poor category, reflecting the dominant mountainous terrain, steep slopes and high surface runoff that restrict infiltration. Lunglei recorded the highest proportion of Very Good potential among the districts at 11.51%, whereas Aizawl recorded only 3.26%.
Surface-water inventory mapping identified major rivers, streams, lakes, ponds and reservoirs directly from satellite imagery. Rivers collectively occupy about 111.6 sq. km (0.53%) of the State, while lakes, ponds and reservoirs account for approximately 22.2 sq. km (0.10%). The Serlui Reservoir, covering about 22 sq. km, was identified as the largest mapped surface-water body.
Overall, the project established a comprehensive spatial baseline for Mizoram’s water resources. Its groundwater-potential maps, surface-water inventory and district-wise statistics provide valuable inputs for water-supply planning, preliminary groundwater exploration, site prioritization for detailed geophysical investigations, watershed management and long-term water-resource development. The report also appropriately cautions that potential-zone mapping should guide, rather than replace, detailed field and geophysical surveys before actual drilling or groundwater development.
Summarized Metadata
Mapping Scale: 1:50,000
Satellite data & Year: IRS P6 LISS IV (2009)
Thematic sub-category: Water resources; Groundwater
Collaborating/Funding Agency: PHED, Government of Mizoram
Report Publication Month/Year: October, 2010