Access Options
Member Only Content
Please log in to view availability or download this document.
| Published | September 29, 2011 |
|---|---|
| Type | Atlas |
| Thematic Category | Geosciences & Disaster Management |
| Project | Disaster Management System |
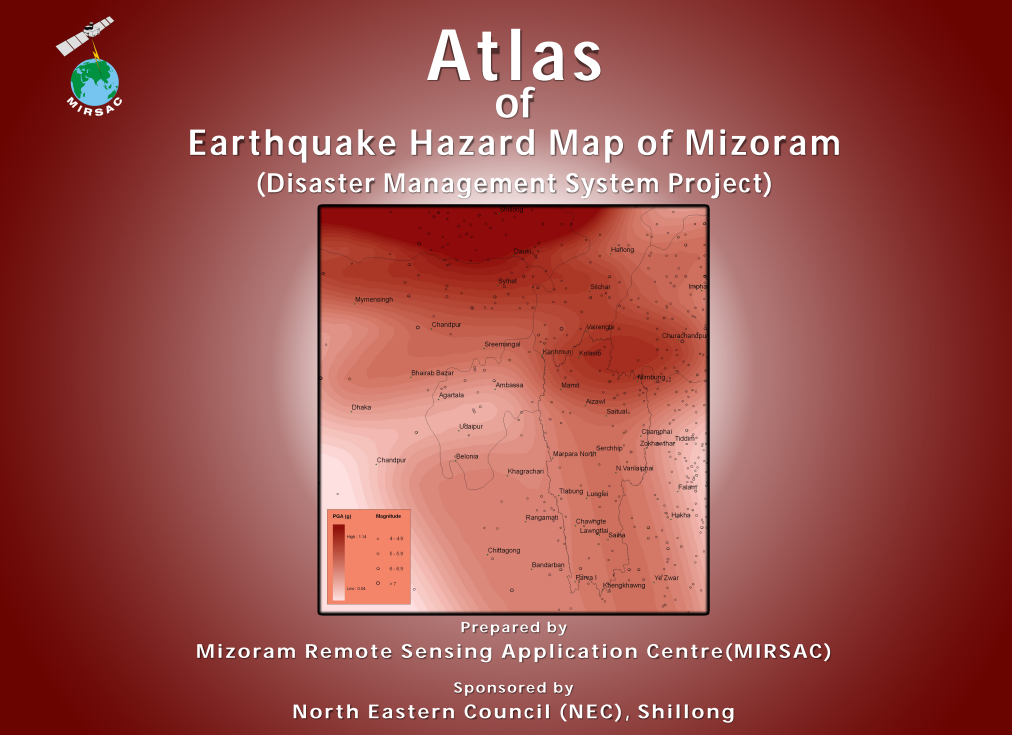
Atlas of Earthquake Hazard Map of Mizoram
Abstract / Description
The “Atlas of Earthquake Hazard Map of Mizoram” was prepared by the Mizoram Remote Sensing Application Centre (MIRSAC), Science & Technology, Planning Department, Government of Mizoram, as a major component of the Disaster Management System (DMS) Project, funded by the North Eastern Council (NEC), Shillong. Published in September 2011, the study was undertaken in recognition of Mizoram’s high seismic vulnerability within Northeast India, a region classified under Seismic Zone V by the Bureau of Indian Standards. The principal objective was to assess and spatially represent variations in earthquake hazard across the State and to establish a geospatial database capable of supporting disaster-management planning, infrastructure development and earthquake-risk mitigation.
The assessment integrated Satellite Remote Sensing and Geographic Information System (GIS) techniques with regional tectonic information and historical seismicity. Input datasets included IRS LISS-III satellite imagery, regional tectonic maps and earthquake catalogues obtained from the India Meteorological Department (IMD), International Seismological Centre (ISC), Advanced National Seismic System/USGS and NEIST, Jorhat, together with ancillary spatial information. Technical capacity for the study was further supported through specialized training provided by the Wadia Institute of Himalayan Geology, Dehradun. Earthquake hazard was expressed in terms of Peak Ground Acceleration (PGA) with a 10% probability of exceedance in 100 years, and maps were prepared at 1:50,000 scale for Mizoram and its eight districts existing at the time.
The statewide analysis covered 21,087 sq. km and indicated PGA values ranging approximately from 0.30 g to 0.54 g, demonstrating considerable spatial variation in expected seismic ground motion. The two dominant classes were 0.36–0.38 g, covering 6,057.50 sq. km (28.73%), and 0.34–0.36 g, covering 5,924.95 sq. km (28.10%); together they account for about 56.83% of the State. A further 2,350.73 sq. km (11.15%) falls within the 0.32–0.34 g class. At the higher end of the hazard spectrum, areas with PGA values of 0.50–0.54 g account for approximately 1,888.47 sq. km (8.95%), while PGA values of 0.44 g and above collectively affect a substantial portion of the State.
Distinct district-level differences were evident. Champhai District displayed one of the widest PGA ranges, extending from 0.30–0.32 g to 0.50–0.52 g, whereas Saiha District was confined mainly to 0.34–0.38 g, with 64.46% of its area in the 0.36–0.38 g category. Lunglei similarly showed predominantly moderate PGA values, with 47.22% of its area in the 0.34–0.36 g range.
Overall, the Atlas provides an important scientific baseline for earthquake-resistant infrastructure planning, building regulation, settlement development, lifeline-network protection, emergency preparedness and State and District Disaster Management Plans. Its GIS-based hazard maps enable planners to incorporate spatial variations in expected seismic ground motion into long-term development and risk-reduction strategies across Mizoram.
Summarized Metadata
Mapping Scale: 1:50,000
Satellite data & Year: IRS P6 LISS III, LISS IV, Cartosat I & Quickbird
Thematic sub-category: Disaster Management; Earthquake
Collaborating/Funding Agency: North Eastern Council, Shillong
Atlas Publication Month/Year: September, 2011