Access Options
Member Only Content
Please log in to view availability or download this document.
| Published | September 29, 2011 |
|---|---|
| Type | Atlas |
| Thematic Category | Geosciences & Disaster Management |
| Project | Disaster Management System |
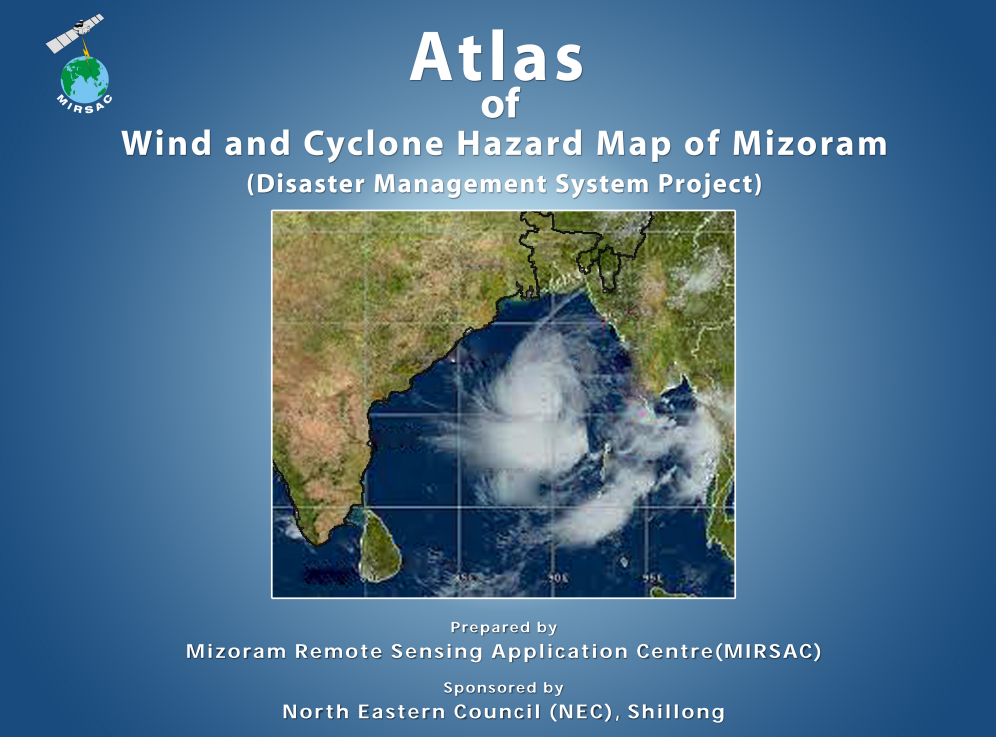
Atlas of Wind & Cyclone Hazard Map of Mizoram
Abstract / Description
The “Atlas of Wind and Cyclone Hazard Map of Mizoram” was prepared by the Mizoram Remote Sensing Application Centre (MIRSAC), Science & Technology, Planning Department, Government of Mizoram, as part of the broader Disaster Management System (DMS) Project funded by the North Eastern Council (NEC), Shillong. Although wind and cyclone hazard mapping was not included in the original project design, its importance emerged during implementation because Mizoram is periodically affected by tropical cyclonic systems originating from the Bay of Bengal and by destructive monsoon storms. The study therefore aimed to identify and spatially classify areas of varying wind and cyclone hazard across Mizoram and generate a geospatial baseline for disaster preparedness, mitigation and development planning.
The assessment employed Satellite Remote Sensing and Geographic Information System (GIS) techniques using IRS LISS-III satellite imagery, ESRI World Map datasets, Meteorological and Oceanic Satellite Data Archival Centre (MOSDAC) information and other ancillary spatial datasets. The resulting hazard maps integrated the zonation with settlements and different classes of road infrastructure, making the outputs suitable for administrative and infrastructure-oriented applications. The analysis classified the State into three broad hazard categories: Very High, High and Moderate wind and cyclone hazard zones.
Across Mizoram's total geographical area of 21,087 sq. km, approximately 3,737.40 sq. km (17.68%) was classified as Very High hazard, while 7,285.57 sq. km (34.50%) fell under the High hazard category. The remaining 10,064.03 sq. km (47.82%) was categorized as Moderate. Thus, more than half of the State, approximately 52.18% or 11,022.97 sq. km falls within High or Very High wind and cyclone hazard zones.
A marked spatial gradient was evident across the State. Lawngtlai District exhibited the highest proportion of Very High hazard terrain, with 53.29% of its area in this category and another 38.30% classified as High, meaning more than 91% of the district falls within the two highest hazard classes. Saiha District similarly recorded 35.52% Very High and 43.73% High hazard, while Lunglei District contained 34.50% Very High and 39.66% High hazard. In contrast, northern districts were comparatively less exposed; Kolasib District was almost entirely Moderate hazard (99.63%) with no mapped Very High zone.
Overall, the Atlas reveals a clear concentration of higher wind and cyclone hazard toward the southern and southwestern parts of Mizoram, consistent with their greater exposure to cyclonic influence. The generated hazard maps and GIS database provide valuable decision-support information for Disaster Management Plans, resilient infrastructure design, settlement and road planning, agricultural protection, emergency preparedness and prioritization of preventive measures, establishing an important baseline for future wind- and cyclone-risk assessment in Mizoram.
Summarized Metadata
Mapping Scale: 1:50,000
Satellite data & Year: IRS P6 LISS III, LISS IV, Cartosat I & Quickbird
Thematic sub-category: Disaster Management; Wind & Cyclone
Collaborating/Funding Agency: North Eastern Council, Shillong
Atlas Publication Month/Year: September, 2011