.png)
Mapping & Growing Stock Assessment of Bamboo in Mizoram using Remote Sensing & GIS (Pre-Bamboo flowering)
The first-phase report of the project “Mapping and Growing Stock Assessment of Bamboo in Mizoram using Remote Sensing and GIS” presents a State-wide assessment of bamboo resources representing the pre-bamboo flowering period, prior to the culmination of widespread gregarious flowering during 2006–2007. The study was undertaken by the Mizoram Remote Sensing Application Centre (MIRSAC) under the Science and Technology, Planning Department, with sponsorship from the Environment & Forest Department, Government of Mizoram. Its principal objective was to quantify the spatial extent, distribution, culm population and growing stock of bamboo across Mizoram and to establish a geospatial baseline for scientific resource management, utilization and subsequent monitoring.The assessment integrated IRS-1D LISS-III satellite data from 2003, 2005 and 2006 and PAN data from 2003, Survey of India topographic sheets at 1:50,000 scale, existing land-use and forest-resource information and intensive field sampling. Satellite imagery was geocoded, enhanced and fused to generate a statewide False Colour Composite mosaic, followed by visual interpretation, ground verification and GIS-based analysis. Field measurements included bamboo diameter, height, weight and culm density, supported by GPS observations. Bamboo areas were classified into Pure, Mixed and Young bamboo forests, and corresponding statistics were generated at district, watershed and forest-division levels.The study estimated a total bamboo-bearing area of 9,029.57 sq. km, equivalent to 42.82% of Mizoram’s geographical area, confirming bamboo as one of the dominant forest resources of the State. The total above-ground green growing stock was estimated at 26.93 million metric tonnes, with an average stock density of approximately 2,982 MT per sq. km. Pure bamboo accounted for the overwhelming share, with about 25.23 million tonnes, compared with 0.91 million tonnes in mixed bamboo and 0.79 million tonnes in young bamboo. The statewide culm population was estimated at approximately 6,867.82 million culms, of which more than 6 billion occurred in pure bamboo forests.Spatially, Lunglei District recorded the largest bamboo area at 2,146.48 sq. km and also the highest growing stock at approximately 6.54 million tonnes, representing 24.29% of the State total. Kolasib showed the highest proportional bamboo cover, with 66.50% of its district area under bamboo, while Champhai recorded the lowest proportional coverage at 18.28%. Tlawng watershed contained the largest absolute bamboo area, whereas Tuiruang watershed recorded the highest proportional watershed coverage at 65.56%.Overall, this first-phase assessment established a critical pre-flowering benchmark for Mizoram’s bamboo resource base. The report also recognized threats from shifting cultivation, forest fire, biotic pressure and the impending large-scale flowering event. The generated bamboo maps, growing-stock estimates and spatial databases therefore provide an essential reference for sustainable harvesting, plantation planning, industrial raw-material assessment, forest management and for evaluating subsequent post-flowering depletion and regeneration. Summarized MetadataMapping Scale: 1:50,000 Satellite data & Year: IRS 1D LISS III (2003, 2005, 2006), IRS 1D PAN (2003).Thematic sub-category: Forestry & EnvironmentCollaborating/Funding Agency: Environment & Forest Department, Government of Mizoram.Report Publication Month/Year: December, 2008
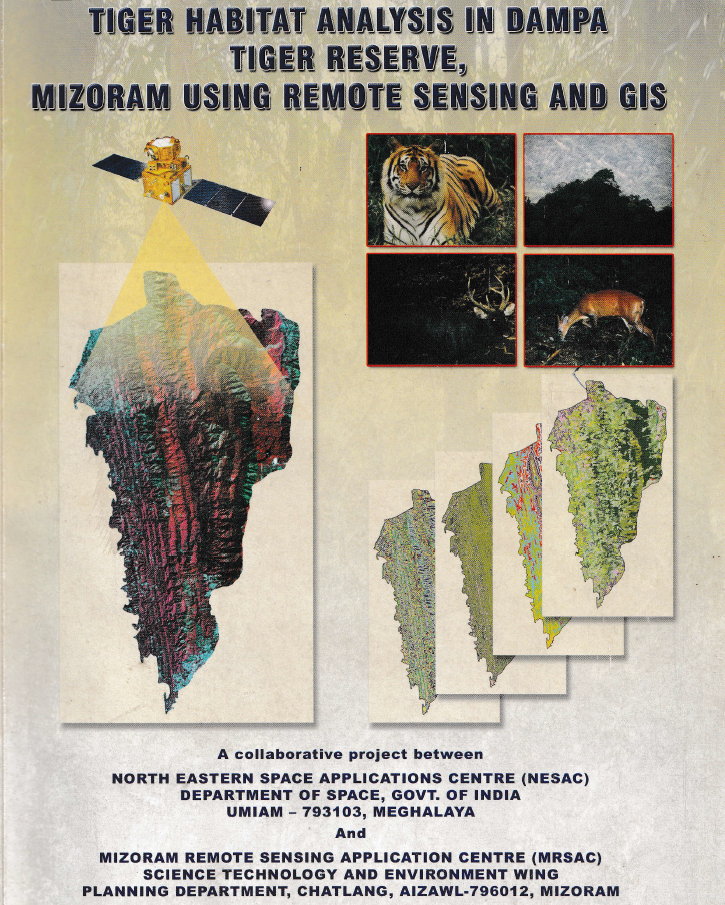
Tiger Habitat Analysis in Dampa Tiger Reserve, Mizoram using Remote Sensing and GIS
The project “Tiger Habitat Analysis in Dampa Tiger Reserve, Mizoram using Remote Sensing and GIS” was undertaken to evaluate the condition, change and suitability of tiger habitat within Dampa Tiger Reserve and its adjoining landscape, and to support scientific conservation and management planning. The study aimed to inventory vegetation types, forest density and water bodies; detect habitat changes between 1978 and 2005; characterize preferred tiger habitat; identify potential habitat and corridors outside the reserve; and develop a digital GIS database for long-term monitoring and management.A multi-temporal remote sensing approach was adopted using Landsat MSS (1978), Landsat TM (1989), IRS-1D LISS-III (1999), IRS-1D PAN (2003) and IRS-P6 LISS-III (2005) imagery, supplemented by reserve boundaries, socio-economic information on surrounding villages and field observations. Vegetation type, forest density, slope, aspect, elevation, proximity to water and tiger pug-mark locations were integrated through GIS-based spatial modelling to derive habitat-suitability classes. Tiger pug marks were treated as indicators of habitat use, and areas associated with higher pug-mark occurrence were interpreted as relatively more suitable habitat.The most significant result was the substantial alteration of forest structure over the 27-year assessment period. Closed evergreen/semi-evergreen forest declined from 36.62% of the reserve in 1978 to 22.88% in 2005, representing a 37.52% reduction. In contrast, bamboo increased by 192.89%, scrub forest by 74.67%, and built-up land by 590%, although the latter remained small in absolute extent. Abandoned jhum declined by 51.52%, while current jhum showed an overall decline of 35.41% between 1978 and 2005 after initially increasing during 1978–1989. The study concludes that much of the original closed forest was replaced by bamboo, scrub and shifting-cultivation landscapes, resulting in increasing fragmentation of tiger habitat.Habitat analysis indicated that closed evergreen/semi-evergreen forests with forest density above 40% were most favourable for tiger use. Areas within 500 m of major rivers were considered highly suitable, while 500–2,000 m distances were moderately suitable. Pug-mark analysis further suggested a strong avoidance of human disturbance: tigers maintained distances of approximately 20 km from the northern inhabited buffer and 25 km from the eastern inhabited buffer, compared with about 10 km from the less-disturbed southern buffer.The surrounding buffer also showed considerable anthropogenic pressure, with current jhum occupying 24.45%, scrub forest 16.32%, abandoned jhum 14.26%, and bamboo 13.14% of the analyzed 5,192.01 ha buffer landscape. Overall, the study identified habitat degradation and shifting cultivation rather than poaching as major constraints on tiger population recovery. The resulting habitat-suitability maps, change-detection products and GIS database provide a valuable scientific basis for habitat restoration, corridor protection, buffer-zone management, monitoring of forest degradation and long-term conservation planning in Dampa Tiger Reserve. Summarized MetadataMapping Scale: 1:50,000 Satellite data & Year: Landsat MSS (1978), Landsat TM (1989), IRS 1D LISS III (1999), IRS 1D PAN (2003), IRS P6 LISS-III (2005).Thematic sub-category: Forestry & EnvironmentCollaborating/Funding Agency: North Eastern Space Applications Centre (NESAC) & Environment & Forest Department, Government of Mizoram.Report Publication Month/Year: October, 2008

Mapping of Forest Administrative Boundary of Mizoram
The project “Mapping of Forest Administrative Boundary of Mizoram using Remote Sensing and GIS” was undertaken by the Mizoram Remote Sensing Application Centre (MRSAC) as an in-house initiative under the Centre’s Annual Plan for 2007–08. The study responded to the need for a standardized and spatially accurate representation of forest administrative jurisdictions in Mizoram, where extensive forest resources, rugged terrain and multiple management authorities make conventional boundary compilation difficult. Its principal objective was to prepare digital forest administrative boundary maps extending from Circle and Division levels down to Forest Ranges, thereby creating a dependable geospatial reference for forest conservation, administration and development planning.The project covered the entire 21,087 sq. km geographical area of Mizoram. Its database incorporated IRS-1D LISS-III satellite imagery, acquired in January 2006, Survey of India topographical sheets at 1:50,000 scale, Forest Department records, field observations and locally obtained information for inaccessible areas. The imagery was geometrically registered and interpreted using ERDAS Imagine, while boundary digitization, integration and analysis were carried out using ARC/INFO GIS. Hand-held GPS instruments supported field verification of selected Forest Division and Range boundaries. The workflow involved pre-field interpretation, ground verification and post-field correction, followed by cross-checking against departmental and ancillary records.A significant finding of the study was that several inconsistencies and anomalies existed in the available administrative records and maps. These were identified, reconciled and corrected through the integration of satellite imagery, GIS analysis, field evidence and institutional inputs. The completed database represented three Territorial Circles comprising 10 Territorial Forest Divisions and 60 Ranges. It also mapped the Wildlife Circle, consisting of the Wildlife Division, Dampa Tiger Reserve and Lawngtlai Wildlife Division, together comprising 10 wildlife ranges or management units. Forest jurisdictions administered by the Lai, Mara and Chakma Autonomous District Councils were separately documented through three Forest Divisions and 13 Ranges. In total, the project spatially organized 16 territorial, wildlife and Autonomous District Council forest divisions and approximately 83 constituent ranges or management units.The principal outputs include detailed administrative maps for individual Forest Divisions, Wildlife Divisions, protected areas, Dampa Tiger Reserve and Autonomous District Council forest jurisdictions, supported by spatial and non-spatial attributes. A consolidated forest administrative boundary map for the whole State was also prepared at 1:250,000 scale.The project established an important digital baseline for the Environment and Forest Department. Its maps and GIS database support working-plan preparation, jurisdictional clarification, forest monitoring, protected-area management, field administration, infrastructure planning and inter-departmental coordination. The data can also be integrated with forest cover, biodiversity, land use, watersheds, roads and settlements, making the report a valuable reference for forest managers, planners, researchers and decision-makers engaged in the sustainable management of Mizoram’s forest resources.Summarized MetadataMapping Scale: 1:50,000 Satellite data & Year: IRS 1D LISS III (2006)Thematic sub-category: Forestry, Administrative boundaryCollaborating/Funding Agency: Mizoram Remote Sensing Application CentreReport Publication Month/Year: March, 2008