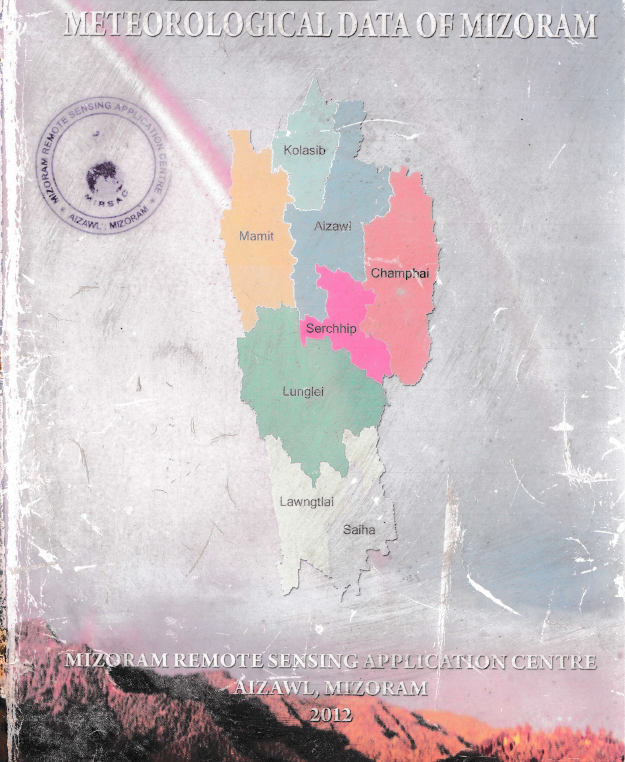
Meteorological Data of Mizoram - 2012
The “Meteorological Data of Mizoram – 2012” report represents the second-phase update of the Meteorological Data of Mizoram project undertaken by the Mizoram Remote Sensing Application Centre (MIRSAC). Building upon the original meteorological compilation published in 2009, this edition extends the available climatic database up to 2011, thereby providing a longer temporal reference for understanding the State’s rainfall, temperature and relative-humidity characteristics. The principal objective was to consolidate dispersed meteorological observations into a systematic, readily accessible database for use in Remote Sensing and GIS studies, natural-resource assessment, development planning and scientific research. Primary observations were compiled from the Department of Agriculture, Department of Economics & Statistics, BRTF–Project Pushpak and Directorate of Science & Technology, Government of Mizoram, supplemented by available meteorological information from MOSDAC and AccuWeather.The report provides district-wise information for all eight districts of Mizoram, with rainfall series extending largely from 1986 to 2011, although temporal coverage varies according to data availability. Temperature information was expanded considerably compared with the earlier edition and is presented for all eight districts, while relative-humidity observations remained more spatially limited. The database demonstrates the strongly monsoonal character of Mizoram’s climate, with rainfall concentrated primarily between May and September. At the State level, the compiled district averages indicate an annual rainfall of approximately 2,693.4 mm, with monthly averages increasing from only 9.3 mm in January to 452.4 mm in July and 460.9 mm in August, before declining after September. This pronounced seasonal concentration has important implications for agriculture, water-resource availability, erosion, landslides and infrastructure management.Temperature observations indicate a generally moderate but seasonally distinct thermal regime. The State-level monthly average mean temperature increases from about 17.5°C in January to approximately 25–26°C during May–September. Average monthly maximum temperatures reach around 33.1°C during April–May, whereas the average minimum falls to about 9.4°C in January. Considerable spatial variation is evident between the warmer lower-elevation districts and cooler elevated locations. Relative humidity likewise follows the monsoonal cycle, increasing substantially from the relatively drier winter and pre-monsoon months and remaining generally around or above 89–92% during the core monsoon months of July–September.Overall, the project established an important long-term meteorological baseline for Mizoram, while also revealing spatial and temporal gaps in the historical observation network. The resulting tables, charts and district-wise climatic summaries constitute a valuable reference for agriculture and horticulture, hydrology, forestry, environmental assessment, disaster-risk studies, infrastructure design, climate analysis and Remote Sensing/GIS modelling, and provide a foundation for continued meteorological database development and future climate-change assessments. Summarized MetadataMapping Scale: N.A Satellite data & Year: N.AThematic sub-category: Meteorology; Climate; Weather dataCollaborating/Funding Agency: Mizoram Remote Sensing Application Centre (MIRSAC)Report Publication Month/Year: May, 2012
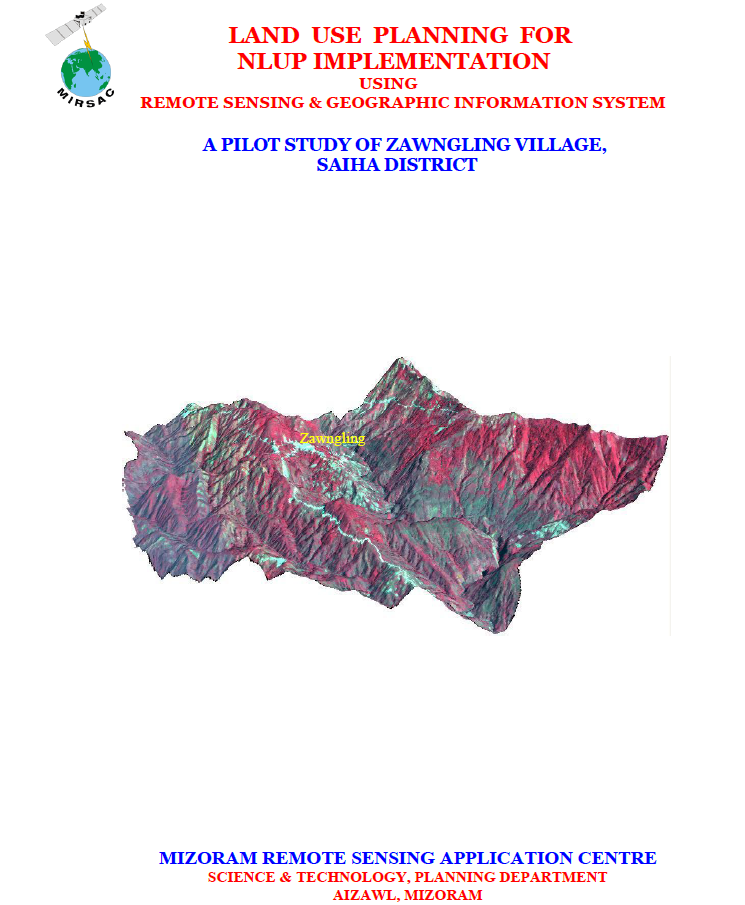
Land Use Planning for NLUP Implementation using Remote Sensing & GIS – A Pilot study of Zawngling Village, Saiha district
The project “Land Use Planning for NLUP Implementation using Remote Sensing & Geographic Information System – A Pilot Study of Zawngling Village, Saiha District”, undertaken by the Mizoram Remote Sensing Application Centre (MIRSAC) in 2010, was conceived as a micro-level scientific planning initiative to support implementation of Mizoram’s New Land Use Policy (NLUP). The study aimed to develop a viable methodology for integrating spatial and non-spatial information, prepare thematic databases on land use/land cover, soils, slope, water resources and socio-economic conditions, and formulate pragmatic land- and water-resource development plans consistent with local resource potential, community needs and government priorities.The study covered Zawngling Village in Saiha District, with a geographical area of 98.02 sq. km, situated in southern Mizoram near the Indo-Myanmar boundary. The project integrated IRS-P6 LISS-IV satellite data and Cartosat-1 stereo PAN imagery acquired in 2009, Survey of India topographic maps, departmental records, field observations and GPS-based ground verification. Image processing and enhancement were undertaken using ERDAS Imagine, while GIS integration and analysis were performed in ARC/INFO. Cartosat stereo imagery supported derivation of terrain parameters, including slope and Digital Elevation Models, while thematic information was prepared at a detailed 1:5,000 mapping scale.The analysis highlighted the strongly undulating character of the village landscape. About 46.08% of the area falls within the 50–100% slope class, while another 10.61% exceeds 100% slope, indicating substantial terrain constraints for conventional agriculture. Land-use assessment showed that forests dominate the landscape: dense forest covers 34.00 sq. km, open forest 16.80 sq. km, bamboo 8.62 sq. km, while current and abandoned shifting cultivation occupy 6.11 and 20.31 sq. km, respectively. Permanent agricultural land remains comparatively limited, with WRC and plantation areas together accounting for less than 1 sq. km. Soil investigations further indicated generally acidic conditions, with several sampled cultivation sites recording pH values around 4.0–4.5, reinforcing the need for site-specific soil-management interventions.Based on integrated GIS analysis, the project proposed 2.75 sq. km for WRC/pisciculture, 3.41 sq. km for terrace cultivation, 5.71 sq. km for agro-horticulture, 4.50 sq. km for agricultural/horticultural plantations, 10.02 sq. km for silviculture/pasture and 14.82 sq. km for afforestation, while retaining major forest and bamboo areas for conservation. Water-resource planning additionally recommended 33 check dams, 26 fish/farm ponds, 12 rainwater-harvesting ponds, 24 intake weirs, 10 distribution tanks and 14 steel gates. Overall, the study demonstrated how high-resolution Remote Sensing, GIS and field-based resource assessment can translate NLUP guidelines into spatially explicit, village-level action plans for sustainable agriculture, water management, livelihood improvement and reduction of dependence on shifting cultivation. Summarized MetadataMapping Scale: 1:5,000 Satellite data & Year: IRS P6 LISS IV (2009) & Cartosat-I (2009)Thematic sub-category: Land resources; Land Use PlanningCollaborating/Funding Agency: NIB (NLUP Implementing Board)Report Publication Month/Year: October, 2010
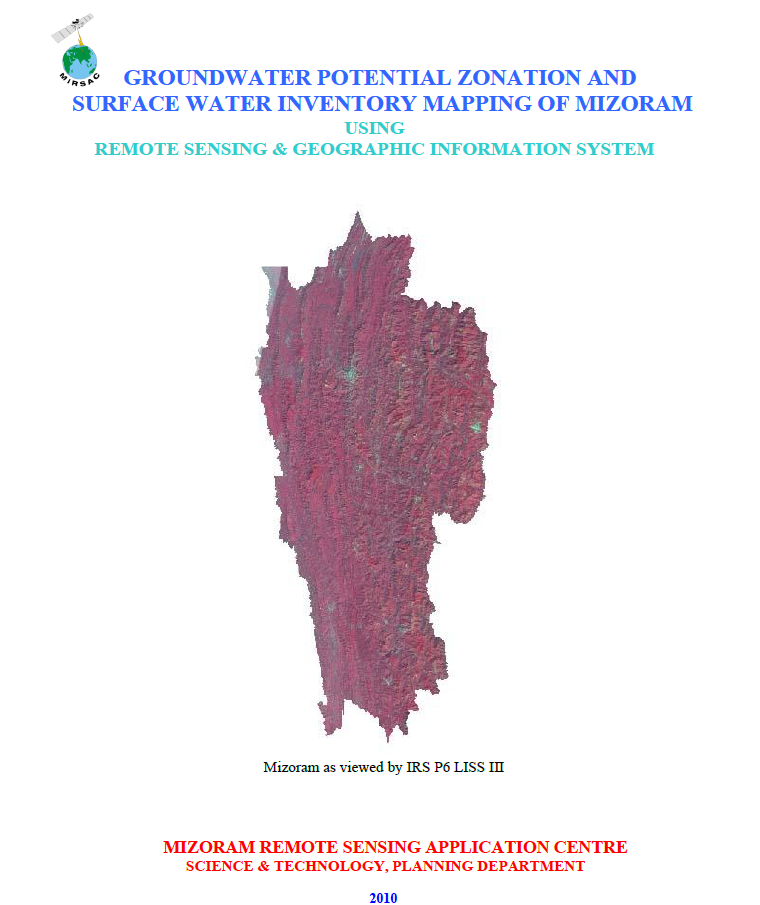
Groundwater Potential Zonation & Surface water inventory mapping of Mizoram using Remote Sensing & GIS
The project “Groundwater Potential Zonation and Surface Water Inventory Mapping of Mizoram using Remote Sensing & Geographic Information System” was undertaken by the Mizoram Remote Sensing Application Centre (MIRSAC), Science & Technology, Planning Department, with funding support from the Public Health Engineering Department (PHED), Government of Mizoram. The study was designed to provide a State-wide scientific assessment of groundwater prospects and surface-water resources to support water-supply planning in a region where rapid population growth and urbanization are increasing demand for dependable water sources. The study covered the entire 21,087 sq. km geographical area of Mizoram and all eight districts.The methodology combined IRS-P6 LISS-III satellite imagery, Survey of India topographic maps, administrative boundaries and ancillary thematic information. The LISS-III data, with 23 m spatial resolution and four spectral bands, were considered suitable for mapping at 1:50,000 scale. Groundwater potential assessment was carried out by integrating lithology, geomorphology, geological structures, slope, Digital Elevation Model information and available spring/hand-pump indicators in an ARC/INFO GIS environment. Individual thematic units were assigned relative weightages based on their hydrogeological significance, and the final groundwater potential map was classified into Very Good, Good, Moderate and Poor zones.The analysis showed that only 1,790.22 sq. km (8.49%) of Mizoram falls under the Very Good groundwater-potential category, primarily within valley fills, flood plains, low-lying terrain and structurally favourable areas. The Good zone covers 4,340.06 sq. km (20.58%), while Moderate potential accounts for 6,655.92 sq. km (31.56%). The largest proportion, 8,300.81 sq. km or 39.36%, lies within the Poor category, reflecting the dominant mountainous terrain, steep slopes and high surface runoff that restrict infiltration. Lunglei recorded the highest proportion of Very Good potential among the districts at 11.51%, whereas Aizawl recorded only 3.26%.Surface-water inventory mapping identified major rivers, streams, lakes, ponds and reservoirs directly from satellite imagery. Rivers collectively occupy about 111.6 sq. km (0.53%) of the State, while lakes, ponds and reservoirs account for approximately 22.2 sq. km (0.10%). The Serlui Reservoir, covering about 22 sq. km, was identified as the largest mapped surface-water body.Overall, the project established a comprehensive spatial baseline for Mizoram’s water resources. Its groundwater-potential maps, surface-water inventory and district-wise statistics provide valuable inputs for water-supply planning, preliminary groundwater exploration, site prioritization for detailed geophysical investigations, watershed management and long-term water-resource development. The report also appropriately cautions that potential-zone mapping should guide, rather than replace, detailed field and geophysical surveys before actual drilling or groundwater development. Summarized MetadataMapping Scale: 1:50,000 Satellite data & Year: IRS P6 LISS IV (2009) Thematic sub-category: Water resources; GroundwaterCollaborating/Funding Agency: PHED, Government of MizoramReport Publication Month/Year: October, 2010
Meteorological Data of Mizoram - 2009
The “Meteorological Data of Mizoram” project was undertaken by the Mizoram Remote Sensing Application Centre (MIRSAC), Science & Technology, Planning Department, Government of Mizoram, to create a consolidated meteorological reference database for scientific studies, Remote Sensing and GIS applications, and development planning in the State. The report reviewed here represents the first phase of the project, covering available meteorological observations primarily for the period 1986–2008 and published in 2009. The initiative responded to the recurring requirement for dependable climatic inputs in natural-resource assessment, agricultural studies, environmental monitoring and other geospatial projects. The database was compiled from records obtained from the Department of Agriculture, Government of Mizoram; Department of Economics & Statistics, Government of Mizoram; and BRTF, Project Pushpak.The report organizes district-wise and State-level information on rainfall, temperature and relative humidity. Rainfall records were available for all eight districts, while temperature data could be compiled for five districts—Kolasib, Aizawl, Champhai, Lunglei and Lawngtlai—and humidity information for four districts. Other meteorological variables such as wind direction, wind velocity and sunshine duration could not be systematically tabulated because adequate historical records were unavailable.The compiled observations reveal Mizoram’s strongly monsoonal climatic regime. State-level rainfall records show considerable inter-annual variation, with annual totals generally exceeding 2,000 mm and several years approaching or surpassing 2,700 mm. Rainfall is concentrated between May and September, while the winter months are comparatively dry. District-level contrasts are also evident: for example, Lawngtlai recorded an average annual rainfall of about 2,532 mm, whereas Mamit averaged approximately 2,692 mm over its available record. Temperature data for Mizoram indicate a relatively moderate thermal regime, with monthly mean temperatures ranging from about 16.4°C in January to approximately 25.4°C in June. Recorded monthly maxima in the district datasets reached around 39°C, while winter minima in some locations fell to near 1–7°C. Relative humidity remained high for much of the monsoon period, with State-level monthly averages reaching around 90% during July–August, compared with generally lower values during the drier winter months.Overall, the project established an important historical climatic baseline for Mizoram. Its organized meteorological tables provide a valuable reference for agriculture and horticulture planning, hydrological studies, forestry, environmental assessment, infrastructure design, disaster-risk analysis, climate-related research and Remote Sensing/GIS modelling. The report also recognized the need for continued database updating, providing the foundation for the subsequent second-phase extension of the meteorological record beyond 2008. Summarized MetadataMapping Scale: N.A Satellite data & Year: N.AThematic sub-category: Meteorology; Climate; Weather dataCollaborating/Funding Agency: Mizoram Remote Sensing Application Centre (MIRSAC)Report Publication Month/Year: November, 2009
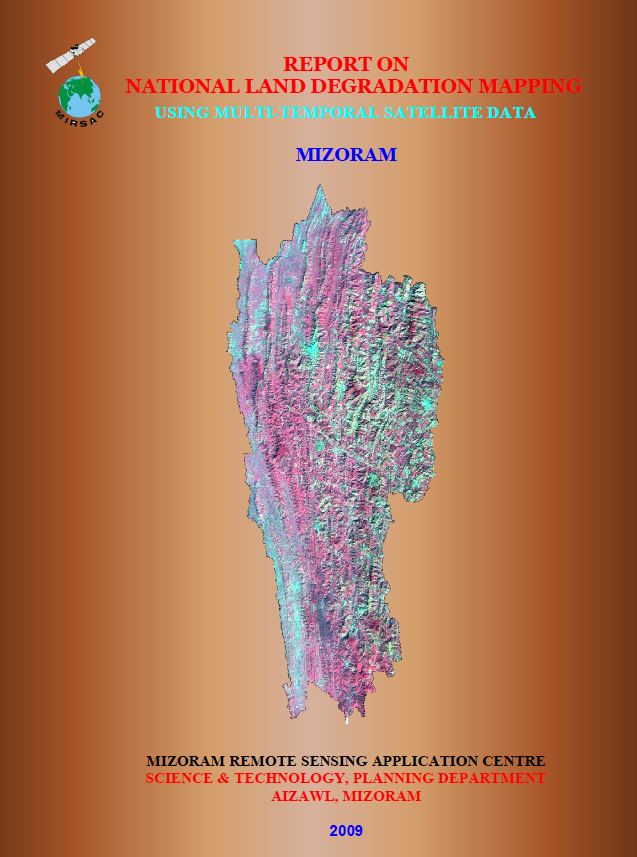
National Land Degradation Mapping using Multi-Temporal Satellite data - Mizoram
The project “National Land Degradation Mapping using Multi-temporal Satellite Data – Mizoram” was undertaken by the Mizoram Remote Sensing Application Centre (MIRSAC) as the State component of the nationwide land-degradation mapping programme initiated under the Natural Resources Census Programme of the Department of Space, Government of India and coordinated by the National Remote Sensing Centre (NRSC), Hyderabad. The study aimed to generate a standardized land-degradation map and digital database for Mizoram at 1:50,000 scale, using three-season multi-temporal IRS-P6 LISS-III data for Kharif, Rabi and Zaid periods of 2005–2006, following the prescribed NRC-LDM classification and codification framework.Mizoram’s rugged hill terrain, steep slopes, high rainfall and extensive shifting cultivation make the State particularly vulnerable to soil erosion and associated land degradation. The assessment therefore focused on identifying the spatial extent, type and severity of degradation and integrating the results into seamless district- and State-level GIS databases suitable for planning, reclamation and monitoring.The study found that water erosion was the dominant primary degradation process, affecting about 4,352.20 sq. km, or 20.63% of Mizoram’s geographical area. Of this, sheet erosion alone accounted for 4,332.62 sq. km (20.55%), making it by far the most widespread degradation class. Sheet erosion was particularly associated with current jhum areas and young abandoned jhum lands, where vegetation removal, steep slopes and intense rainfall accelerate topsoil loss.A second major concern was soil acidification, which affected nearly 60% of the State, generally in the moderate acidic range. The report links this condition to leaching of base cations under heavy rainfall, resulting in reduced soil pH and impaired nutrient uptake. District-level analysis revealed substantial variation: Champhai recorded about 29.67% of its area under sheet erosion, Serchhip about 29.10%, Lawngtlai 24.37%, Saiha 19.80%, Lunglei 18.44%, Mamit 14.59%, and Kolasib 11.75%. Soil acidity was especially extensive in Kolasib (76.01%), Mamit (70.42%) and Lunglei (65.93%).Overall, the project established that approximately one-fifth of Mizoram is affected by primary land degradation, predominantly through water erosion, while moderate soil acidity constitutes an even broader secondary constraint. The study highlights shifting cultivation as a major driver of erosion and recommends alternative cultivation systems and reclamation measures to arrest further degradation. The resulting maps and GIS database provide an important scientific baseline for soil and water conservation, watershed development, land reclamation, agricultural planning, jhum management, productivity improvement and future monitoring of landscape degradation across Mizoram. Summarized MetadataMapping Scale: 1:50,000 Satellite data & Year: IRS 1D LISS-III (2005 & 2006)Thematic sub-category: Land Resources, SoilCollaborating/Funding Agency: National Remote Sensing Centre (NRSC)Report Publication Month/Year: October, 2009