Digital Mapping of Village Boundary of Mizoram using Remote Sensing and GIS
The project “Digital Mapping of Village Boundary of Mizoram using Remote Sensing and GIS” was undertaken by the Mizoram Remote Sensing Application Centre as an in-house initiative to establish a standardized, spatially referenced database of village administrative boundaries across the State. The study recognized that clearly defined village jurisdictions are fundamental to decentralized planning, infrastructure development, resource allocation and implementation of area-specific government programmes. Its principal objective was to prepare accurate village-boundary maps using satellite imagery, Survey of India topographic sheets and departmental land records, and to preserve the resulting spatial and attribute information in digital form for future use by MRSAC and other government agencies.The project covered the entire 21,087 sq. km geographical area of Mizoram, comprising the eight districts of Mamit, Kolasib, Aizawl, Champhai, Serchhip, Lunglei, Lawngtlai and Saiha, including areas administered by the Lai, Mara and Chakma Autonomous District Councils. The primary remote-sensing input was IRS-1D LISS-III imagery with 23.5 m spatial resolution, acquired in January 2006. This was supplemented by Survey of India topographic maps at 1:50,000 scale, records supplied by the Land Revenue and Settlement Department, collateral administrative information and field observations. Image registration and interpretation were carried out using ERDAS Imagine, while boundary digitization, database preparation and spatial integration were undertaken in ARC/INFO GIS.The methodology consisted of pre-field, field and post-field stages. Existing maps and departmental records were initially compiled and compared with geometrically corrected satellite imagery. Doubtful boundary sections and village locations were subsequently verified through field surveys using handheld GPS instruments. In inaccessible areas, information was obtained through consultations with Village Council members and local residents. Following field verification, the boundaries were corrected, cross-checked and incorporated into district-wise and statewide digital maps.The completed assessment documented 709 villages, 23 notified towns and 158 urban wards across the eight districts. Lunglei District recorded the largest number of villages at 159, closely followed by Lawngtlai with 158, while Serchhip had the fewest at 34. Aizawl District contained the highest number of urban wards, reflecting the concentration of population and administrative functions around the State capital. A consolidated village-boundary map for the whole of Mizoram was also prepared at 1:250,000 scale, supported by detailed district and town maps.A major outcome of the project was the identification and correction of inconsistencies in earlier village-boundary records through the integration of departmental information, satellite data and ground evidence. The resulting GIS database provides an important baseline for village-level administration, rural development, census analysis, infrastructure planning, land and natural-resource management, watershed programmes and equitable allocation of development schemes. Overall, the project demonstrated the effectiveness of Remote Sensing, GIS and participatory field verification for establishing reliable administrative boundaries and supporting evidence-based micro-level planning in Mizoram. Summarized MetadataMapping Scale: 1:50,000 Satellite data & Year: IRS 1D – LISS III (2006)Thematic sub-category: Administrative, Village boundaryCollaborating/Funding Agency: Mizoram Remote Sensing Application CentreReport Publication Month/Year: March, 2008
Micro Landslide Hazard Zonation Mapping of Aizawl City
The project “Micro Landslide Hazard Zonation Mapping of Aizawl City using Remote Sensing and GIS” was undertaken by the Mizoram Remote Sensing Application Centre to produce a detailed spatial assessment of landslide susceptibility within Aizawl City. The study was initiated in response to recurrent slope failures, rapid urban expansion and increasing development pressure on the city’s narrow ridges and steep hill slopes. Its principal objective was to identify areas of varying landslide hazard, analyse the major causative factors influencing slope instability and provide a scientific basis for safer land-use planning, infrastructure development and disaster-risk mitigation.The study covered the entire Aizawl urban area of 128.98 sq. km. High-resolution QuickBird imagery with 0.8 m spatial resolution was used as the primary dataset, supplemented by IRS-P5 Cartosat-I stereo data at 2.5 m resolution, Survey of India topographic maps, field observations and GPS-based ground verification. Five principal thematic parameters—land use/land cover, slope, geomorphology, lithology and geological structure—were generated and integrated in ARC/INFO GIS using a weighted heuristic approach. Additional consideration was given to active and old landslides, fault proximity, road cutting, drainage conditions and dip-slope relationships. The final hazard maps were prepared at 1:5,000 scale, with grid-wise reference maps also produced at 1:20,000.The results demonstrate the inherent fragility of Aizawl’s terrain. About 64.22% of the city lies on slopes exceeding 40°, including 63.95% within the 40–60° class, indicating that steep terrain is the dominant physical constraint. Scrubland forms the largest land-use category, occupying 52.51 sq. km or 40.71%, while built-up areas already cover 18.23 sq. km or 14.13%. Geomorphologically, medium and low structural hills together account for more than 96% of the study area, whereas valley fills occupy only 0.28%, confirming the scarcity of naturally stable flat land. Lithological analysis shows that sandstone covers 39.41%, while crumpled shale and shale-sandstone units together occupy over 45%, creating extensive zones of relatively weak and weathering-prone material.The hazard zonation classified the city into five categories. Very High and High Hazard Zones together cover 37.77 sq. km, or 29.28% of the city, representing areas where construction and major development require avoidance or stringent geotechnical scrutiny. The Moderate Hazard Zone is the largest class at 56.66 sq. km (43.93%), while Low and Very Low Hazard Zones account for 20.61% and 6.18%, respectively. High-risk locations were associated with active landslides, faults, crumpled shale, steep road cuts, quarrying, poor drainage and dense settlement.The project’s principal outcome is a detailed GIS-based hazard database for Aizawl City. It provides planners, engineers, municipal authorities and disaster-management agencies with an operational tool for site selection, building regulation, road and drainage design, slope stabilization, emergency planning and hazard-sensitive urban development. Summarized MetadataMapping Scale: 1:5,000 Satellite data & Year: IRS P5 Cartosat-I & Quickbird (2006)Thematic sub-category: Forestry, Administrative boundaryCollaborating/Funding Agency: Science, Technology & Environment Wing, Planning Department, Government of MizoramReport Publication Month/Year: March, 2008
Mapping of Agriculture/Horticulture Potential areas within R.Tut Riverine Reserve Forest, Mamit District
The project “Mapping of Agriculture and Horticulture Potential Areas within R. Tut Riverine Reserve Forest, Mamit District, Mizoram using Remote Sensing and GIS” was undertaken by the Mizoram Remote Sensing Application Centre, with sponsorship from the Environment and Forest Department, Government of Mizoram. The study was conceived to identify cultivable land within the legally protected riverine reserve and to provide a scientific basis for evaluating possible agricultural and horticultural development in accordance with the Forest (Conservation) Act, 1980. The study area covered the River Tut Riverine Reserve Forest, extending approximately 800 metres on both sides of the river, with a total mapped area of 141.85 sq. km.The assessment integrated IRS-1D LISS-III satellite data acquired in January 2006, IRS-P5 Cartosat-I stereo data acquired during 2006, Survey of India topographic maps, field observations and departmental information. Image processing and preliminary interpretation were carried out using ERDAS Imagine, while GIS integration, slope generation, thematic overlay and area computation were performed using ARC/INFO. Ground verification included GPS-based observations of wetland rice fields, plantations, forest types and potentially cultivable areas, supplemented by information from Forest, Agriculture and Horticulture authorities and local residents.Land-use analysis showed that bamboo forest was the dominant cover, occupying 76.45 sq. km or 53.90% of the study area. Dense, medium-dense and open forests together accounted for 38.80 sq. km, while current and abandoned shifting cultivation occupied 11.34 sq. km. Existing kharif cropland and agriculture-horticulture plantations covered only 1.97 sq. km and 0.45 sq. km, respectively, indicating that much of the cultivation potential had not yet been developed. Slope assessment revealed that the largest class was the 35–50% slope category, covering 38.79 sq. km or 27.34%, although several low-lying valley and foothill areas suitable for wetland cultivation were also identified.Land-capability analysis classified the area into five capability subclasses. The largest class was IVe, covering 40.59%, representing land suitable for agro-horticulture, sericulture and silvipastoral development with appropriate erosion-control measures. Class IIe and IIIe lands, considered suitable for agriculture and horticulture, together accounted for approximately 28.29% of the study area.The integrated suitability analysis identified 15.18 sq. km or 10.70% as potential agricultural land, mainly for wetland rice and double cropping in valley bottoms and foothills. A substantially larger area of 82.29 sq. km or 58.01% was assessed as suitable for horticulture and agroforestry. The potential areas were further divided into 36 sectors, each mapped at 1:25,000 scale to support site-specific planning.Overall, the project produced a detailed spatial database and sector-wise maps for balancing agricultural development with forest conservation. The outputs provide valuable decision support for evaluating forest-diversion proposals, planning irrigation and crop development, prioritizing field verification and implementing environmentally responsible agriculture and horticulture programmes in Mamit District. Summarized MetadataMapping Scale: 1:50,000 Satellite data & Year: IRS 1D – LISS III (2006); Cartosat-1 (April & December, 2006)Thematic sub-category: Agriculture/Horticulture, ForestryCollaborating/Funding Agency: Environment & Forest Department, Government of MizoramReport Publication Month/Year: March, 2008
Report on Landslides in Mizoram
The Report on Landslides in Mizoram, prepared by the Mizoram Remote Sensing Application Centre (MRSAC) under the Science and Technology Wing, Planning Department, Government of Mizoram, was compiled in 2007 in response to the increasing incidence of landslides and associated disruptions across the State's mountainous terrain. The study was undertaken to document recent landslide occurrences, assess their geographical distribution and impacts, and provide an initial scientific understanding of landslide susceptibility across Mizoram, particularly following intense monsoon rainfall during September 2007.The project employed Remote Sensing and Geographic Information System (GIS) techniques to prepare a generalized Landslide Hazard Zonation (LHZ) map for the State. IRS-1D LISS-III satellite imagery acquired in February 2003, together with Survey of India topographic maps at 1:50,000 scale and available ancillary spatial datasets, was used to analyse terrain and geo-environmental conditions. Key causative parameters—including lithology, geological structure, geomorphology, slope, and land use/land cover—were integrated using ARC/INFO GIS software to classify Mizoram into five relative landslide hazard categories. The analysis provided a statewide framework for identifying areas of varying susceptibility and understanding the influence of both natural terrain conditions and human interventions such as road cutting and quarrying.The report also compiled field and administrative information on landslide impacts from across all eight districts of Mizoram, documenting damage to houses, roads, bridges, public utilities, and communication networks. The assessment highlights the vulnerability of settlements and infrastructure during periods of intense rainfall and demonstrates the widespread nature of landslide-related hazards in the State.A key outcome of the project was the preparation of a generalized Landslide Hazard Zonation Map of Mizoram, providing an important baseline for disaster preparedness and mitigation. The report emphasizes that although landslides cannot be completely prevented, their impacts can be reduced through appropriate land-use planning, slope stabilization, safer infrastructure development, and avoidance of highly susceptible areas.The resulting landslide inventory, hazard zonation map, spatial information, and documented observations provide valuable reference material for government departments, disaster management authorities, planners, engineers, researchers, and local administrations. The information can support road and infrastructure planning, hazard monitoring, emergency preparedness, environmental management, and prioritization of mitigation measures, while also providing a foundation for more detailed, site-specific landslide susceptibility and risk assessments in the future.Summarized MetadataMapping Scale: 1:50,000 Satellite data & Year: IRS 1D LISS III (2003)Thematic sub-category: Landslide, Disaster ManagementCollaborating/Funding Agency: Mizoram Remote Sensing Application CentreReport Publication Month/Year: September, 2007
Natural Resources Mapping of Saiha District using Remote Sensing and GIS
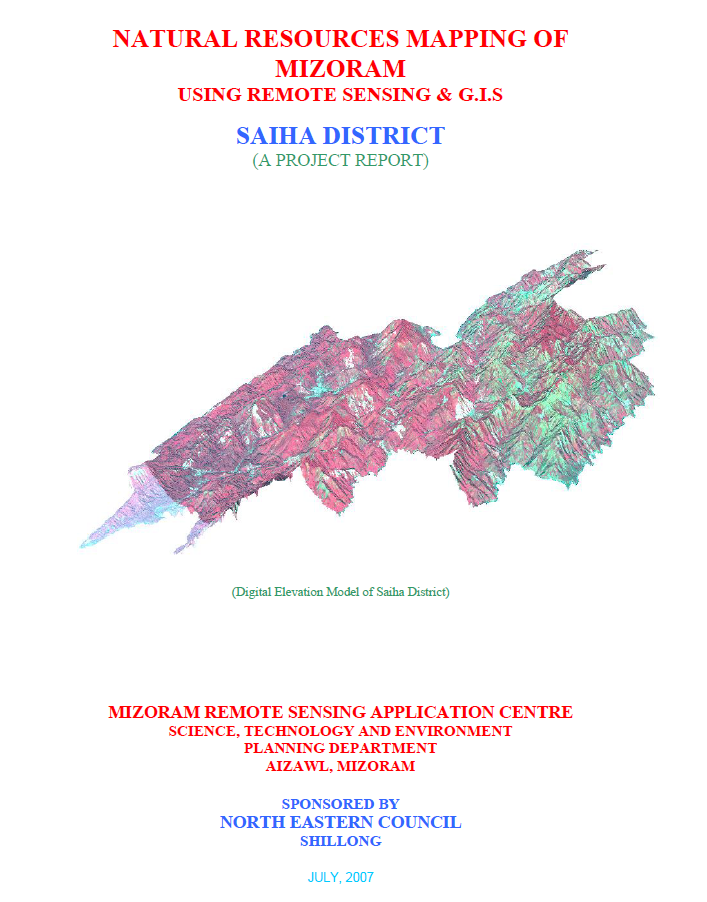
The Natural Resources Mapping of Saiha District using Remote Sensing and GIS was undertaken by the Mizoram State Remote Sensing Centre (MSRSC), Science, Technology & Environment Wing, Planning Department, Government of Mizoram, under the Natural Resources Mapping of Mizoram programme funded by the North Eastern Council (NEC), Shillong. The project formed part of a comprehensive three-year state-wide initiative to develop an integrated geospatial database of Mizoram's natural resources using Remote Sensing (RS), Geographic Information System (GIS), GPS-assisted field surveys, and conventional resource investigations. Its primary objective was to generate reliable thematic information on the district's land, water, forest, and terrain resources to support scientific planning, sustainable development, and long-term natural resource management.The study encompasses the entire Saiha District, covering approximately 1,399.16 sq. km, or about 6.64% of Mizoram's geographical area. High-resolution IRS-1D LISS-III and Panchromatic satellite imagery, together with Survey of India topographic maps, geological data, meteorological records, soil surveys, and extensive field verification, were integrated within a GIS environment to prepare detailed thematic maps on land use/land cover, geology, geomorphology, drainage, watershed boundaries, groundwater potential, soils, slope, aspect, settlements, and transportation networks. The integration of these datasets enabled a comprehensive assessment of the district's natural resources and facilitated the preparation of integrated land and water resource development plans.The analysis shows that Saiha District is characterized by rugged structural hill ranges, deeply incised valleys, and a dense drainage network dominated by the Kolodyne (Chhimtuipui) River and its tributaries. Terrain analysis indicates that steep and moderately steep slopes occupy the majority of the district, significantly influencing land capability, settlement distribution, and agricultural practices. The district remains predominantly forested, with forest and bamboo forest together accounting for nearly 70% of the total geographical area, highlighting its importance as one of Mizoram's ecologically rich landscapes. The land use assessment also identifies current shifting cultivation (approximately 94 sq. km, 6.7%) and young abandoned jhum (around 166 sq. km, 11.9%) as major land-use categories, reflecting the continuing influence of traditional shifting cultivation on the landscape. Permanent agriculture and horticultural plantations occupy comparatively smaller but steadily expanding areas, particularly within valley bottoms and gentle slopes.Groundwater assessment indicates that poor groundwater potential predominates across nearly half of the district, largely due to the steep terrain and rapid runoff, while moderate groundwater potential occupies approximately one-third of the area, mainly along valleys and structurally favourable zones. Soil investigations reveal predominantly acidic hill soils derived from sedimentary rocks of the Surma Group, possessing moderate organic matter but requiring appropriate conservation measures because of their susceptibility to erosion on steep slopes. The watershed analysis further identifies priority areas for rainwater harvesting, soil conservation, and integrated watershed development.A major outcome of the project is the establishment of a district-level natural resources information integrating all thematic datasets within a GIS platform for resource evaluation and spatial planning. Based on the integrated assessment, the report recommends watershed development, afforestation, bamboo resource management, agroforestry, horticultural expansion, groundwater development, and scientific land capability-based planning to optimize resource utilization while conserving the district's fragile hill ecosystem.Overall, the study demonstrates the effectiveness of combining Remote Sensing, GIS, GPS, and field investigations for comprehensive natural resource assessment in mountainous regions. The thematic maps, digital databases, and resource development plans generated under the project provide an invaluable baseline for government agencies, planners, researchers, and development organizations, supporting evidence-based planning, environmental conservation, and sustainable management of Saiha District's diverse natural resources.Summarized MetadataMapping Scale: 1:50,000Satellite data & Year: IRS 1D PAN & LISS III (2003 & 2004) – Digital & Photo printThematic sub-category: Land Use/Land Cover, Geology, Water resource, Climate, Action Plan Collaborating/Funding Agency: North Eastern Council (NEC), ShillongReport Publication Month/Year: July, 2007