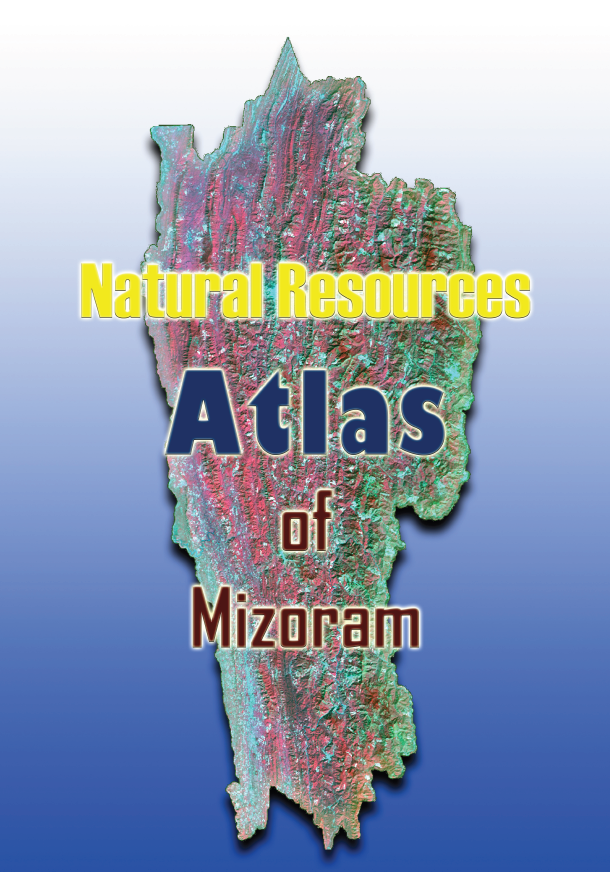
Natural Resources Atlas of Mizoram
The Atlas of Natural Resources of Mizoram is a comprehensive geospatial reference publication prepared by the Mizoram State Remote Sensing Centre (MSRSC) under the Science, Technology & Environment Wing, Planning Department, Government of Mizoram. Published in 2009, the Atlas represents the culmination of the Natural Resources Mapping of Mizoram project, a state-wide initiative funded by the North Eastern Council (NEC), Shillong, and subsequently supported by the Government of Mizoram for the compilation and publication of this integrated reference volume. Unlike the individual district reports, which present detailed technical analyses, the Atlas consolidates the findings from all districts into a single, visually rich document that provides a comprehensive overview of Mizoram's natural resources through thematic maps, state-wide statistics, and spatial analyses.Prepared using Remote Sensing, Geographic Information System (GIS), GPS-based field verification, and conventional resource surveys, the Atlas integrates information derived from high-resolution IRS satellite imagery with field observations and existing geoscientific data. It presents an extensive collection of standardized maps covering major natural resource themes, including land use land cover, geology, geomorphology, soils, drainage, watersheds, groundwater potential, slope, aspect, elevation, transportation networks, settlements, and integrated land and water resource development action plans. In addition to district-wise thematic maps, the Atlas introduces consolidated state-level resource inventories and statistical summaries, enabling readers to visualize the spatial distribution, extent, and diversity of Mizoram's natural resources at a broader regional scale.One of the principal strengths of the Atlas lies in its ability to transform large volumes of technical geospatial information into an accessible and user-friendly reference. By combining district-level datasets into a unified state-wide perspective, it highlights regional variations in terrain, forest resources, agricultural landscapes, watershed systems, soil characteristics, groundwater prospects, and land capability. The Atlas also provides valuable insights into the distribution of shifting cultivation, forest cover, bamboo resources, and environmentally sensitive areas, thereby serving as an important baseline for monitoring land-use change and supporting evidence-based environmental planning. The standardized thematic maps facilitate comparison across districts and offer an integrated understanding of the interrelationships between natural resources, physiography, and developmental potential.Designed as a multidisciplinary reference, the Atlas serves a wide spectrum of users, including government departments, planners, researchers, academic institutions, engineers, environmental managers, and policymakers. The information compiled within the Atlas supports applications in watershed management, forestry, agriculture, horticulture, infrastructure planning, groundwater exploration, disaster risk reduction, biodiversity conservation, environmental impact assessment, and sustainable regional development. Even years after its publication, the Atlas continues to serve as an invaluable baseline document for geospatial planning and natural resource management in Mizoram.User Advisory: Owing to the inclusion of numerous high-resolution thematic maps covering the entire State of Mizoram, the digital version of this Atlas is large in size (exceeding 300 MB). Users should expect longer download times depending on their internet connection, and opening the document may require considerable system memory and processing resources, particularly on older computers or mobile devices. For users requiring only a quick overview of the state's natural resources, a condensed edition containing the consolidated state-wide maps and statistical summaries is also available upon request, offering a more lightweight and convenient alternative for general reference.Summarized MetadataMapping Scale: 1:50,000Satellite data & Year: IRS 1D PAN & LISS III (2003 & 2004) Thematic sub-category: Land Use/Land Cover, Geology, Water resource, Climate, Action Plan Collaborating/Funding Agency: Science, Technology & Environment Wing, Planning Department, Government of MizoramReport Publication Month/Year: June, 2009
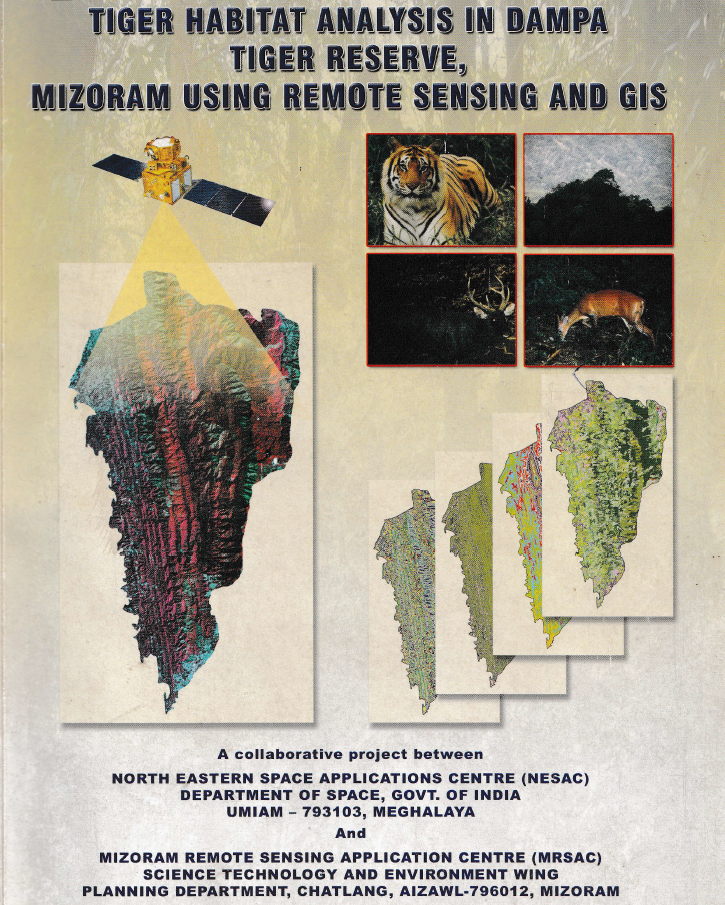
Tiger Habitat Analysis in Dampa Tiger Reserve, Mizoram using Remote Sensing and GIS
The project “Tiger Habitat Analysis in Dampa Tiger Reserve, Mizoram using Remote Sensing and GIS” was undertaken to evaluate the condition, change and suitability of tiger habitat within Dampa Tiger Reserve and its adjoining landscape, and to support scientific conservation and management planning. The study aimed to inventory vegetation types, forest density and water bodies; detect habitat changes between 1978 and 2005; characterize preferred tiger habitat; identify potential habitat and corridors outside the reserve; and develop a digital GIS database for long-term monitoring and management.A multi-temporal remote sensing approach was adopted using Landsat MSS (1978), Landsat TM (1989), IRS-1D LISS-III (1999), IRS-1D PAN (2003) and IRS-P6 LISS-III (2005) imagery, supplemented by reserve boundaries, socio-economic information on surrounding villages and field observations. Vegetation type, forest density, slope, aspect, elevation, proximity to water and tiger pug-mark locations were integrated through GIS-based spatial modelling to derive habitat-suitability classes. Tiger pug marks were treated as indicators of habitat use, and areas associated with higher pug-mark occurrence were interpreted as relatively more suitable habitat.The most significant result was the substantial alteration of forest structure over the 27-year assessment period. Closed evergreen/semi-evergreen forest declined from 36.62% of the reserve in 1978 to 22.88% in 2005, representing a 37.52% reduction. In contrast, bamboo increased by 192.89%, scrub forest by 74.67%, and built-up land by 590%, although the latter remained small in absolute extent. Abandoned jhum declined by 51.52%, while current jhum showed an overall decline of 35.41% between 1978 and 2005 after initially increasing during 1978–1989. The study concludes that much of the original closed forest was replaced by bamboo, scrub and shifting-cultivation landscapes, resulting in increasing fragmentation of tiger habitat.Habitat analysis indicated that closed evergreen/semi-evergreen forests with forest density above 40% were most favourable for tiger use. Areas within 500 m of major rivers were considered highly suitable, while 500–2,000 m distances were moderately suitable. Pug-mark analysis further suggested a strong avoidance of human disturbance: tigers maintained distances of approximately 20 km from the northern inhabited buffer and 25 km from the eastern inhabited buffer, compared with about 10 km from the less-disturbed southern buffer.The surrounding buffer also showed considerable anthropogenic pressure, with current jhum occupying 24.45%, scrub forest 16.32%, abandoned jhum 14.26%, and bamboo 13.14% of the analyzed 5,192.01 ha buffer landscape. Overall, the study identified habitat degradation and shifting cultivation rather than poaching as major constraints on tiger population recovery. The resulting habitat-suitability maps, change-detection products and GIS database provide a valuable scientific basis for habitat restoration, corridor protection, buffer-zone management, monitoring of forest degradation and long-term conservation planning in Dampa Tiger Reserve. Summarized MetadataMapping Scale: 1:50,000 Satellite data & Year: Landsat MSS (1978), Landsat TM (1989), IRS 1D LISS III (1999), IRS 1D PAN (2003), IRS P6 LISS-III (2005).Thematic sub-category: Forestry & EnvironmentCollaborating/Funding Agency: North Eastern Space Applications Centre (NESAC) & Environment & Forest Department, Government of Mizoram.Report Publication Month/Year: October, 2008
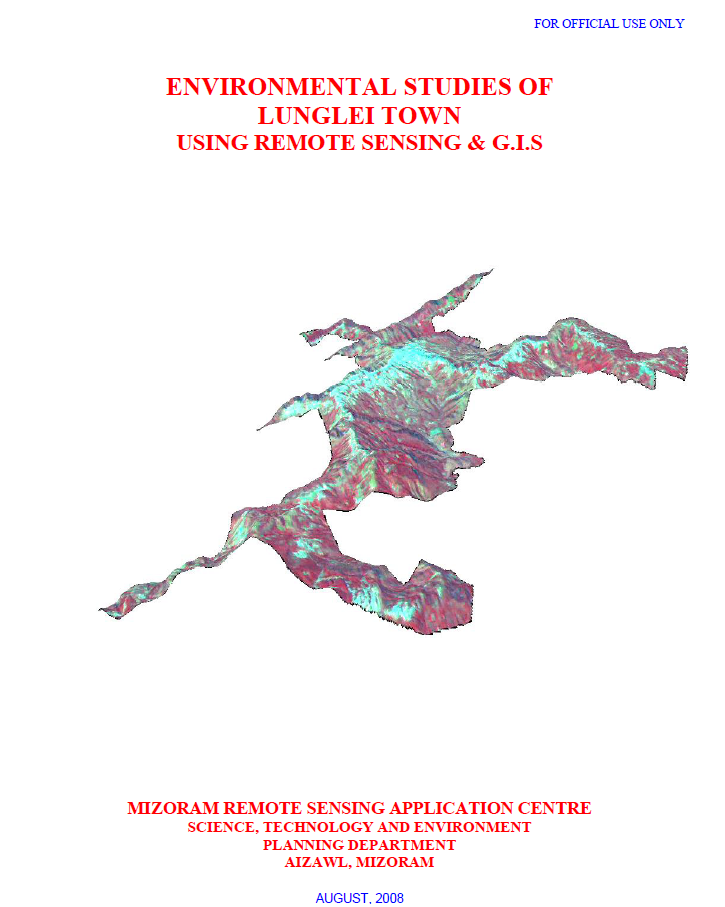
Environmental Studies of Lunglei town using Remote Sensing and GIS
The project “Environmental Studies of Lunglei Town using Remote Sensing & GIS”, undertaken by the Mizoram Remote Sensing Application Centre (MIRSAC), Science, Technology & Environment, Planning Department, Government of Mizoram, and published in August 2008, was designed to develop an integrated environmental database for sustainable urban planning in Lunglei. The study addressed growing concerns associated with heavy rainfall, unstable slopes and rocks, water scarcity during the dry season, vegetation degradation, pollution and expanding human activities. Its objectives covered the assessment of climate, surface-water resources, groundwater potential, water quality, geology, geomorphology, landslide hazards, slope, aspect, altitude, soils and land use/land cover, culminating in recommendations for environmental management and development planning.The study covered 55.08 sq. km of Lunglei Town, the second-largest settlement in Mizoram. It employed Cartosat-I PAN data (2006), Resourcesat LISS-IV data (2007), Survey of India topographic sheets, meteorological and socio-economic information, departmental records and extensive ground observations. Image processing and interpretation were carried out using ERDAS Imagine, while spatial integration and analysis were undertaken in ARC/INFO GIS. Field verification included handheld GPS observations of landslides, springs, wells, geology and vegetation, along with soil sampling and laboratory analysis.The integrated assessment highlighted several environmental constraints. Groundwater potential mapping classified only 11.04% of the town as Very Good and 21.00% as Good, whereas 38.02% fell within the Poor category, indicating significant dependence on surface and harvested rainwater resources. The report notes an annual rainfall of approximately 3,352 mm and demonstrates that a 60 sq. m roof could theoretically harvest about 201,120 litres annually, underscoring the potential of rooftop rainwater harvesting.Landslide susceptibility emerged as another major concern. The study area forms part of the Lunglei anticline, characterized by steep slopes, soft sedimentary rocks, lineaments and faults, with about 45.32 km of mapped structural discontinuities. Landslide zonation incorporated slope, lithology, geomorphology, geological structure, land use, road cutting and known landslides. The Very High Hazard Zone alone covers 1.07 sq. km (1.94%), including parts of Theiriat, Hauruang, Hrangchalkawn, Bazar Veng and western Zotlang.Land-use analysis shows that built-up land occupies 6.77 sq. km (12.29%), while open and dense scrub together cover over 41%, reflecting extensive disturbed vegetation. Land-capability assessment further indicates that 38.44% of the area falls under Class IVe, suitable mainly for agro-horticulture and related uses with erosion-control measures, whereas only 1.70% represents good arable Class IIe land.Overall, the project established a multidisciplinary environmental baseline for Lunglei Town and demonstrated the value of integrating Remote Sensing, GIS and field investigations for urban environmental assessment. Its thematic maps, hazard information and resource databases provide an important scientific foundation for land-use regulation, water-resource development, landslide mitigation, infrastructure planning, vegetation conservation and long-term sustainable urban development. Summarized MetadataMapping Scale: 1:10,000 Satellite data & Year: ResourceSat – LISS IV (2007) & Cartosat-1 (2006)Thematic sub-category: Multi-ThematicCollaborating/Funding Agency: Science & Technology wing, Planning DepartmentReport Publication Month/Year: August, 2008
Mapping of Potential Areas for Wet Rice Cultivation in Mizoram using Remote Sensing and GIS
The project “Mapping of Potential Areas for Wet Rice Cultivation in Mizoram using Remote Sensing and Geographic Information System” was undertaken by the Mizoram Remote Sensing Application Centre (MRSAC), Science & Technology, Planning Department, Government of Mizoram, as an in-house study completed in July 2008. The project was initiated in response to Mizoram’s limited availability of level and gently sloping land, which constrains the expansion of wet rice cultivation in the State’s predominantly rugged and mountainous terrain. Its principal objective was to identify, delineate and quantify potential areas for wet rice cultivation across all eight districts and to generate supporting thematic maps on slope and land use/land cover for agricultural planning.The assessment used IRS-1D LISS-III satellite imagery with a spatial resolution of 23.5 metres, Survey of India topographic maps at 1:50,000 scale, ancillary departmental information and extensive field verification. Image registration and interpretation were undertaken using ERDAS Imagine, while digitization, spatial integration, analysis and map preparation were carried out in ARC/INFO GIS. Handheld GPS observations and information from Village Councils and local residents were used to verify uncertain or inaccessible locations. Areas with slopes between 0 and 25% were primarily classified as wet rice cultivation potential, while terrace cultivation was considered feasible up to approximately 33% slope, following ICAR recommendations. Most potential areas were associated with heavy soils having good water-retention capacity and pH values generally ranging from 4.5 to 5.8.The study identified a total of 746.44 sq. km of potential wet rice cultivation land, representing only 3.54% of Mizoram’s total geographical area of 21,087 sq. km. This confirms that suitable land is scarce and largely confined to river valleys, flood plains, foothills and narrow low-lying basins. Mamit District recorded the largest potential area at 201.82 sq. km, followed by Lunglei (127.97 sq. km) and Lawngtlai (114.05 sq. km). Kolasib contained the highest proportional availability, with 6.82% of its district area classified as potential, closely followed by Mamit at 6.67%. Aizawl District had the lowest potential, covering about 41.4 sq. km or 1.16% of its area. Important concentrations included the Teirei and Langkaih valleys in Mamit, Serlui and Chemlui valleys in Kolasib, Champhai Zawl and the Tiau–Tuipui systems in Champhai, Mat Zawlpui in Serchhip, and the Tuichawng–Chamdur region in Lawngtlai.The project produced district-wise and statewide maps, spatial databases and area statistics that provide a scientific baseline for irrigation development, land improvement, accessibility assessment and prioritization of field-level agricultural interventions. Overall, the study demonstrated the effectiveness of Remote Sensing, GIS and GPS-supported verification for identifying scarce cultivable valleys and supporting evidence-based strategies to improve rice production and food security in Mizoram. Summarized MetadataMapping Scale: 1:50,000 Satellite data & Year: IRS 1D – LISS III (2006)Thematic sub-category: AgricultureCollaborating/Funding Agency: Mizoram Remote Sensing Application CentreReport Publication Month/Year: July, 2008
Mapping of Forest Administrative Boundary of Mizoram
The project “Mapping of Forest Administrative Boundary of Mizoram using Remote Sensing and GIS” was undertaken by the Mizoram Remote Sensing Application Centre (MRSAC) as an in-house initiative under the Centre’s Annual Plan for 2007–08. The study responded to the need for a standardized and spatially accurate representation of forest administrative jurisdictions in Mizoram, where extensive forest resources, rugged terrain and multiple management authorities make conventional boundary compilation difficult. Its principal objective was to prepare digital forest administrative boundary maps extending from Circle and Division levels down to Forest Ranges, thereby creating a dependable geospatial reference for forest conservation, administration and development planning.The project covered the entire 21,087 sq. km geographical area of Mizoram. Its database incorporated IRS-1D LISS-III satellite imagery, acquired in January 2006, Survey of India topographical sheets at 1:50,000 scale, Forest Department records, field observations and locally obtained information for inaccessible areas. The imagery was geometrically registered and interpreted using ERDAS Imagine, while boundary digitization, integration and analysis were carried out using ARC/INFO GIS. Hand-held GPS instruments supported field verification of selected Forest Division and Range boundaries. The workflow involved pre-field interpretation, ground verification and post-field correction, followed by cross-checking against departmental and ancillary records.A significant finding of the study was that several inconsistencies and anomalies existed in the available administrative records and maps. These were identified, reconciled and corrected through the integration of satellite imagery, GIS analysis, field evidence and institutional inputs. The completed database represented three Territorial Circles comprising 10 Territorial Forest Divisions and 60 Ranges. It also mapped the Wildlife Circle, consisting of the Wildlife Division, Dampa Tiger Reserve and Lawngtlai Wildlife Division, together comprising 10 wildlife ranges or management units. Forest jurisdictions administered by the Lai, Mara and Chakma Autonomous District Councils were separately documented through three Forest Divisions and 13 Ranges. In total, the project spatially organized 16 territorial, wildlife and Autonomous District Council forest divisions and approximately 83 constituent ranges or management units.The principal outputs include detailed administrative maps for individual Forest Divisions, Wildlife Divisions, protected areas, Dampa Tiger Reserve and Autonomous District Council forest jurisdictions, supported by spatial and non-spatial attributes. A consolidated forest administrative boundary map for the whole State was also prepared at 1:250,000 scale.The project established an important digital baseline for the Environment and Forest Department. Its maps and GIS database support working-plan preparation, jurisdictional clarification, forest monitoring, protected-area management, field administration, infrastructure planning and inter-departmental coordination. The data can also be integrated with forest cover, biodiversity, land use, watersheds, roads and settlements, making the report a valuable reference for forest managers, planners, researchers and decision-makers engaged in the sustainable management of Mizoram’s forest resources.Summarized MetadataMapping Scale: 1:50,000 Satellite data & Year: IRS 1D LISS III (2006)Thematic sub-category: Forestry, Administrative boundaryCollaborating/Funding Agency: Mizoram Remote Sensing Application CentreReport Publication Month/Year: March, 2008